Home
Mailgun Blog
IT & Engineering category
Here’s what you don’t know about MongoDB that can increase your performance by 30x
IT & Engineering
How we realized a 30x performance improvement in MongoDB read preference
Performance metrics can be sensitive. When response times suddenly spike – figuring out why can be a challenge. Is it your servers? Your code? Or is it a tiny setting or best practice buried somewhere in MongoDB…
PUBLISHED ON
You know what they say…the more redundant you are, the more redundant you are.
Replica sets are database processes that provide high availability and reduce server failover through redundancy. They are the foundation for production deployments and aren’t really intended to be stand-alone tools that improve your response time and performance metrics. At Mailgun, we noticed high response times in one of our nodes that supports these processes. We hate being slowed down – especially when it doesn’t make sense. So, we set out to fix it.
Table of contents
Abnormal response times: Finding root cause
Back in 2021, we noticed some strange performance issues in our response times for USW2. Why are we bringing this up now? Well, we’re still benefiting from the updates we made and we’re looking to share the love.
We first noticed our rate limit service (based of Gubernator) was showing consistent response times of 150ms for our processes in USW2. Weirdly, the same code was averaging around 5ms in the 99th percentile of requests. This latency was particularly odd since we average around a 2ms response time in the 50th percentile. So, there was something there we really needed to investigate.
Our starting point was to compare metrics between USW2 and USW1. We added some additional metrics to report how long it took to fetch rate limit definitions from MongoDB (when the cache missed), which allowed us to get a better understanding of what was going on.
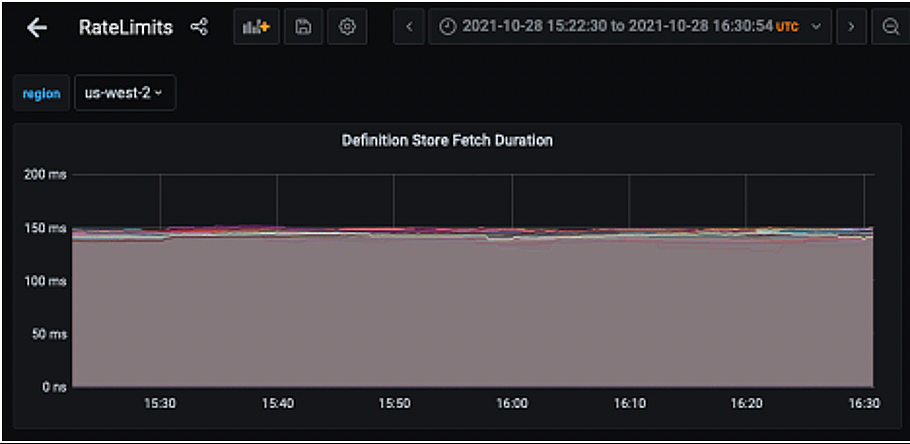
The resulting graph confirmed the 150ms trend in USW2 but also showed 2-5ms response times from MongoDB in USE1. This isolated the issue, confirming that something was up with the MongoDB configuration affecting USW2 specifically.
MongoDB performance: Documentation insights
So, that was ‘Step 1: Locating the issue’ completed.
Next, we took a deep dive into MongoDB documentation. The eureka moment came once we understood the MongoDB main topology and discovered the MongoDB default read preferences. MongoDB clients prefer the primary instance in a cluster when performing reads. It’s not always nice when your DB plays favorites.
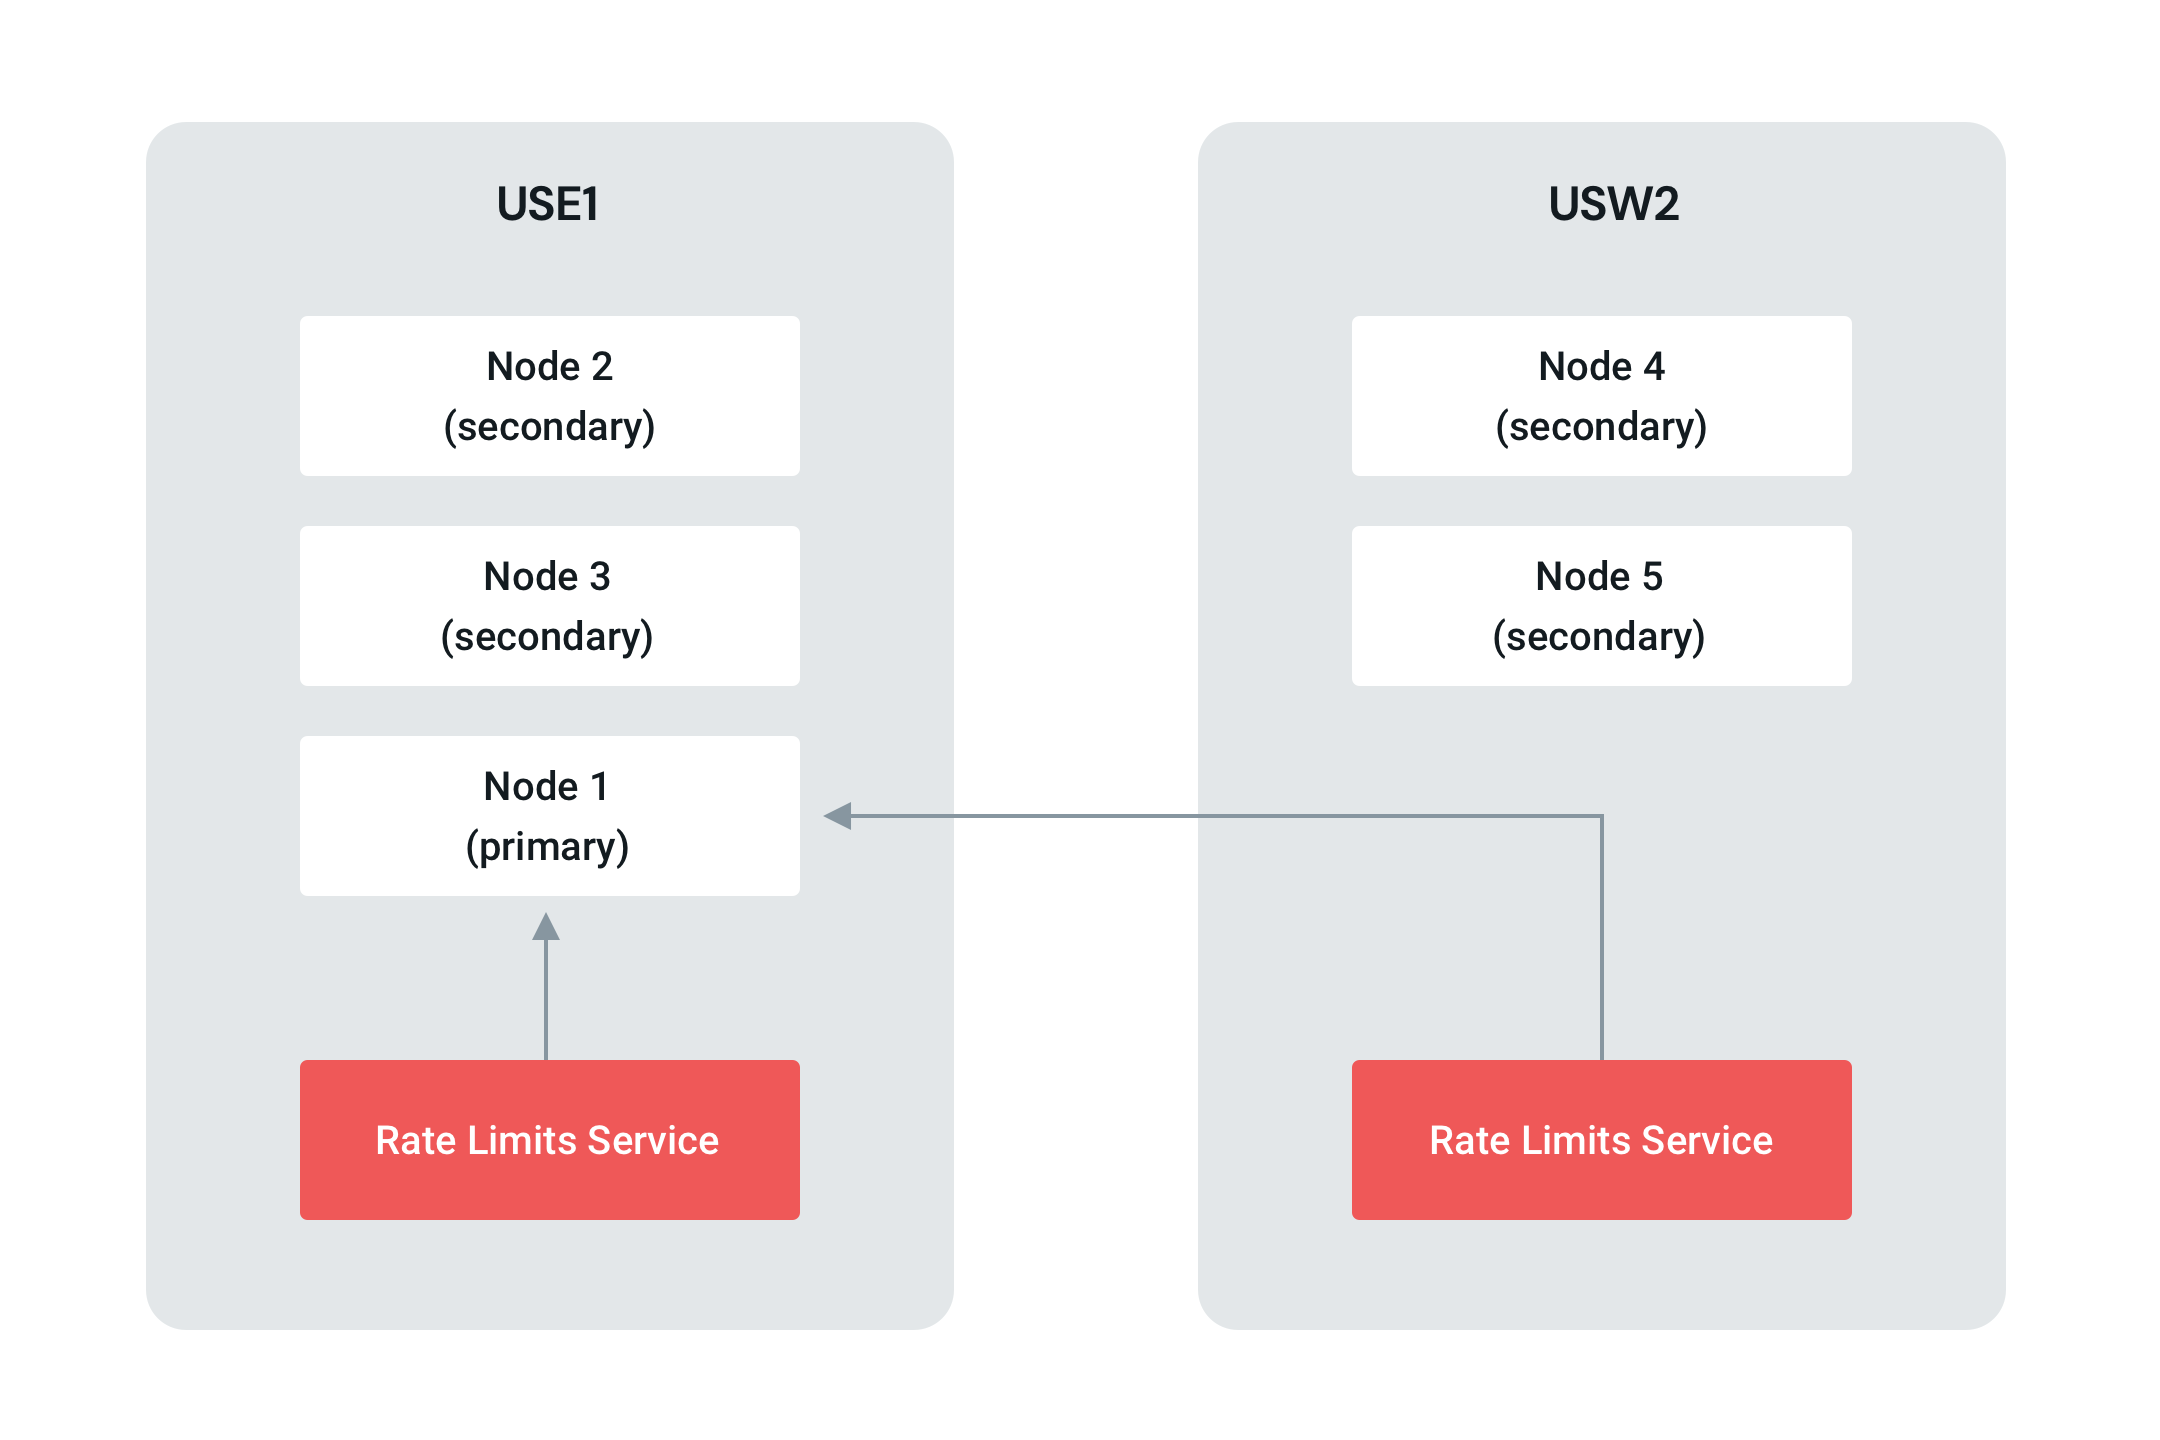
In the default MongoDB client configuration, the client in USW2 was reading cross region to the primary node in USE1. MongoDB defaults are set to where operations read from secondary members, unless the set has a single primary.
Their documentation indicated that if we were to use readPreference=secondaryPreferred in our MongoDB client, we would be able to connect to the local MongoDB nodes instead of only the primary (USE1).
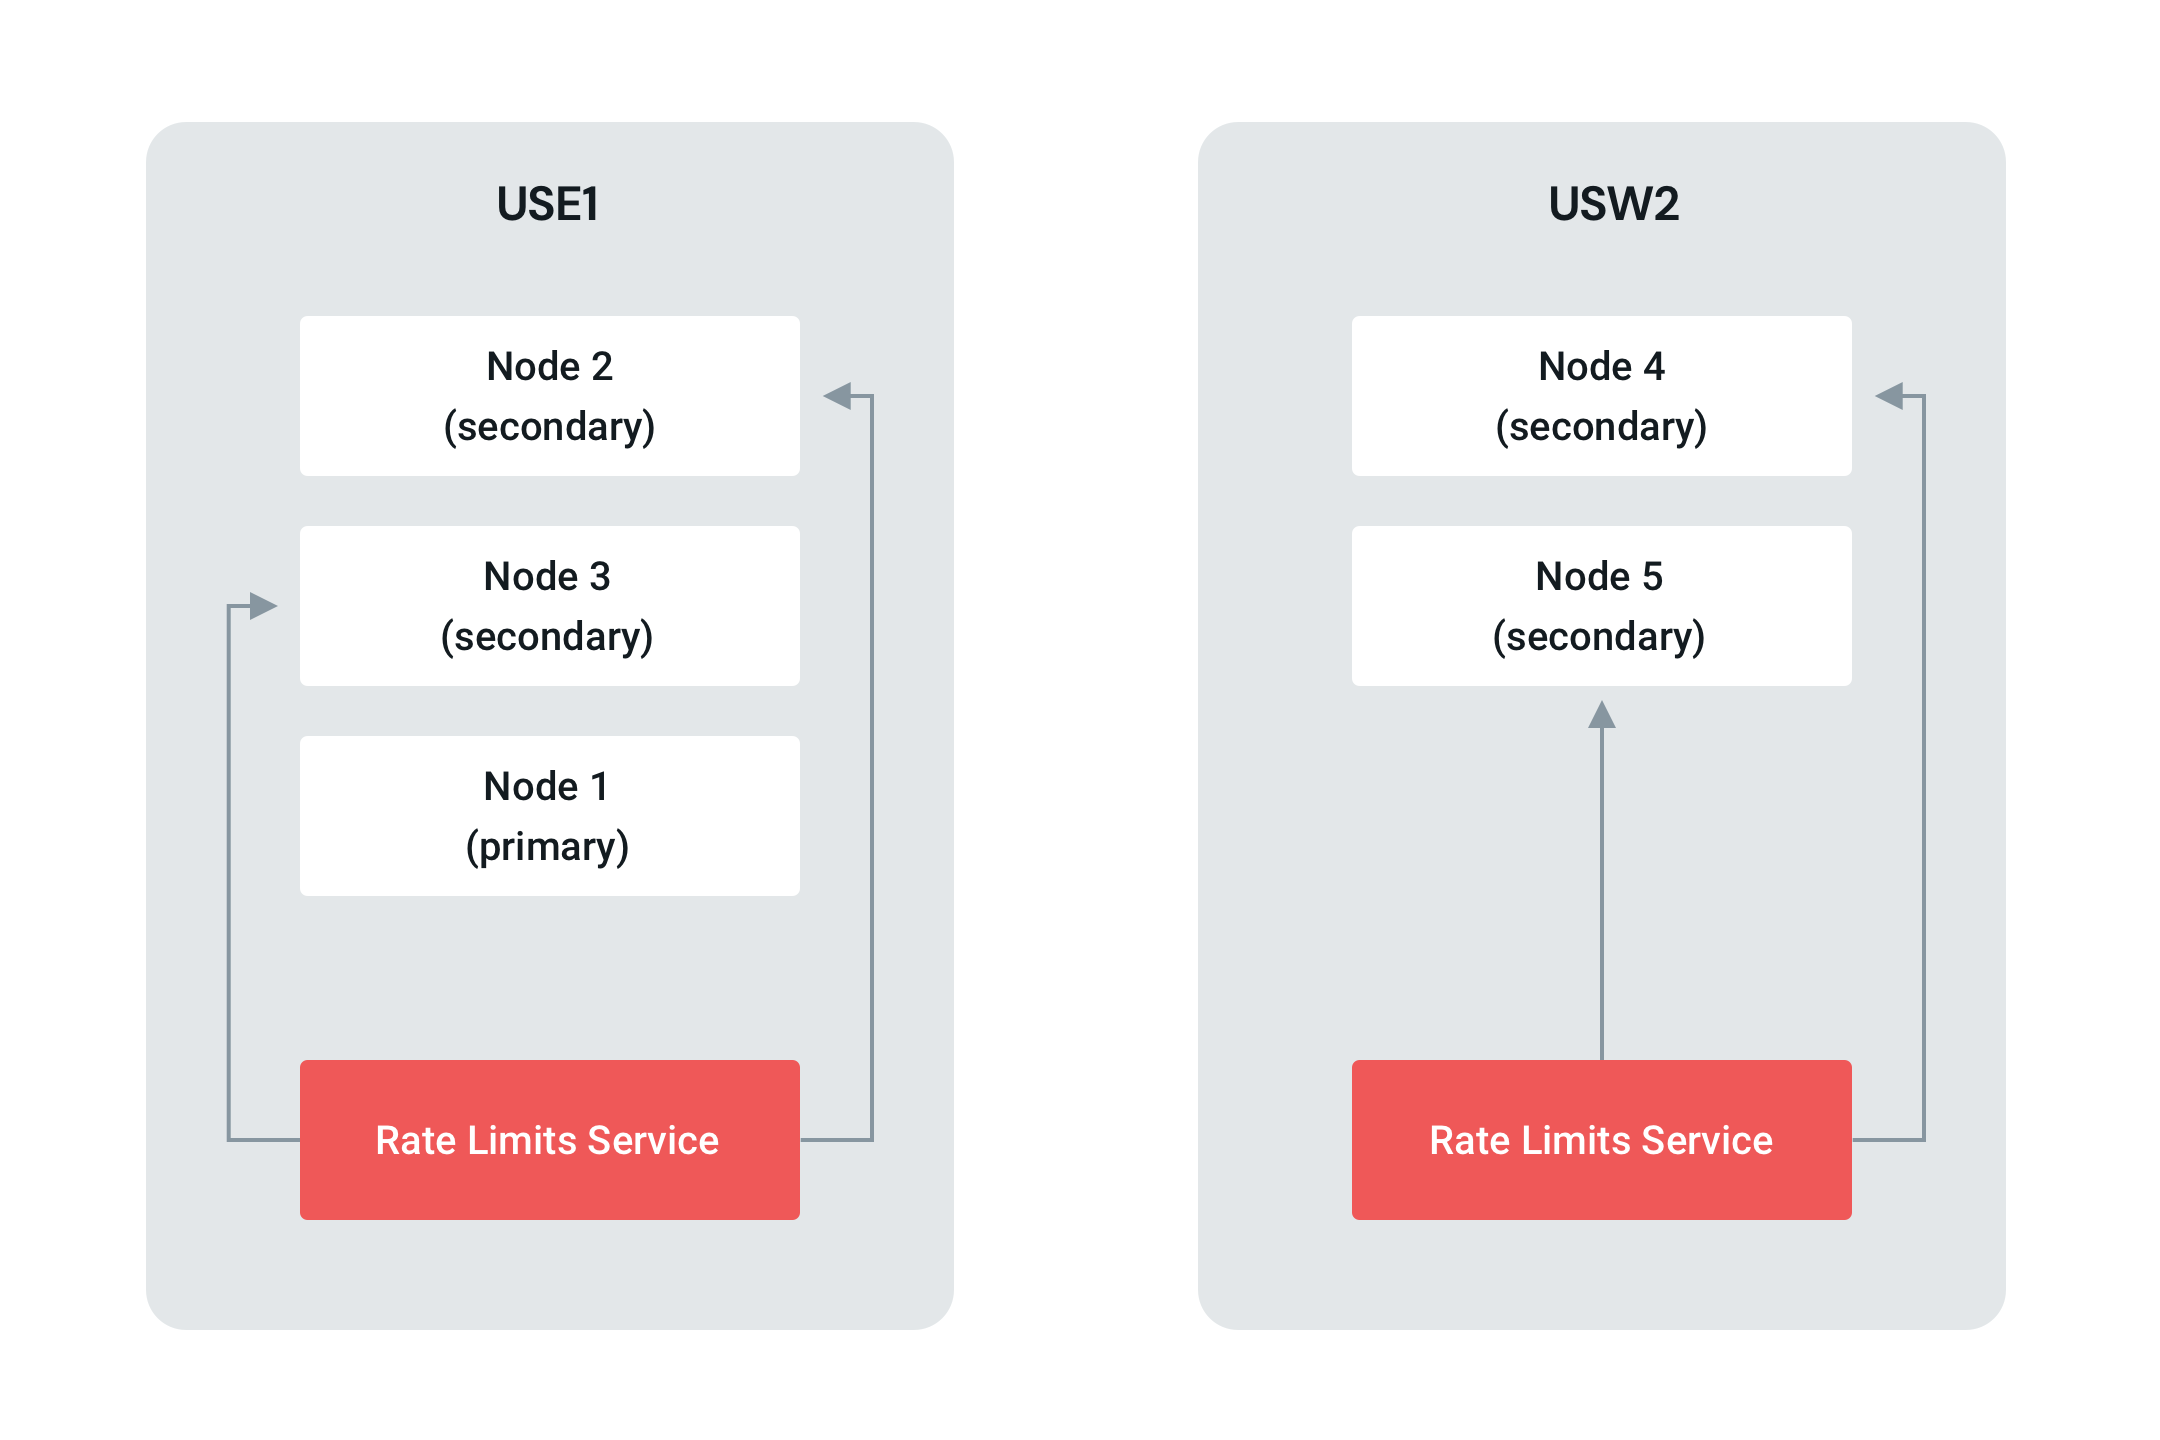
Perfect. This structuring would allow us to optimize performance, spreading reads across multiple secondary servers where each server is responding to fewer read requests. We thought that updating our read preference would solve the issue but it’s never that simple, is it? Sometimes the situation is more of a clusterf@%* (pun intended).
Troubleshooting the Golang Mongo Client
We really thought we nailed it with those read preferences but now we were failing to connect to the cluster using the URI:
Turns out, we were using an older version of the MongoDB client (go.mongodb.org/mongo-driver v1.0.2) that didn’t support our TLS options. Once we figured that out, we were finally able to deploy and see if the update to our read preference had any impact once we upgraded to go.mongodb.org/mongo-driver v1.7.3, and fixed a minor URI format issue with our framework:
PSA: If your URI Options are not working and the Mongo driver doesn’t give you an error, you are running an older version of Mongo and will need to update.
MongoDB performance improvement
This finally did the trick. The effect was dramatic, resulting in a ~30x improvement (response time of 5-10ms in the 99th percentile) in read performance for USW2. Not bad.
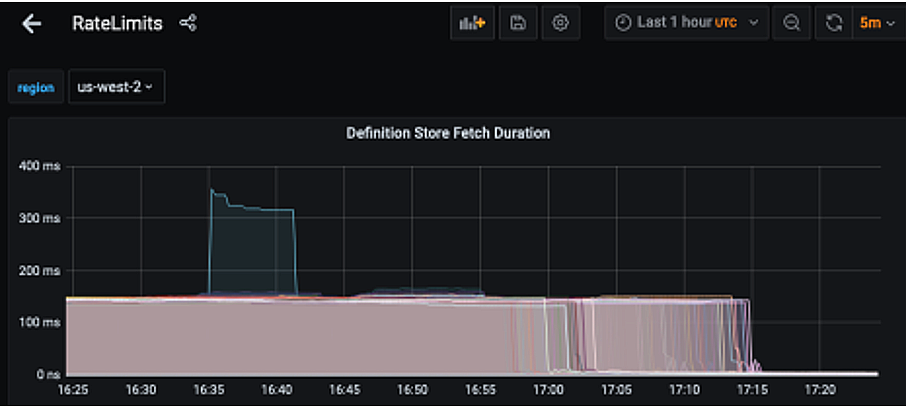
Our solution started with an investigation of fetch rates to isolate the affected server and led us to optimize our read preference logic based on MongoDB client documentation. Ultimately, we discovered this was also a version issue and we needed to update our MongoDB Go Driver to successfully connect to the cluster URI and improve our response time.
How we continue to optimize
Diagnosing root cause is part of the dev journey and resolving performance issues is done a layer at a time. If you’re experiencing similar latency in your metrics, start with assessing your servers, rate limiting services, and don’t forget to check the feature supports of your Mongo driver version.
Investigations and updates like this are how we work to create a better overall system and user experience. So, if you want to hear more from our Engineering team, be sure to subscribe so you don’t miss out on future stories and operation insights.

