Email metrics explained: Understanding email performance
Your ESP’s reporting dashboard is full of important metrics to measure your efforts as a sender. These statistics track the stages of delivery of an email from your ESP to your recipient’s inbox. We’ll run through this journey and explain every metric on the way.
PUBLISHED ON
A trip to your email analytics dashboard usually comes before a team meeting or after a product owner asks how many email subscribers are viewing content on a mobile device. On the surface, email marketing metrics appear simple – open rates and click-through rates are pretty self-explanatory. But in reality, your message takes a journey from your application, server, or mail client through the internet service provider (ISP) and onto the inbox. There are plenty of hurdles to jump through before (hopefully) arriving in the inbox.
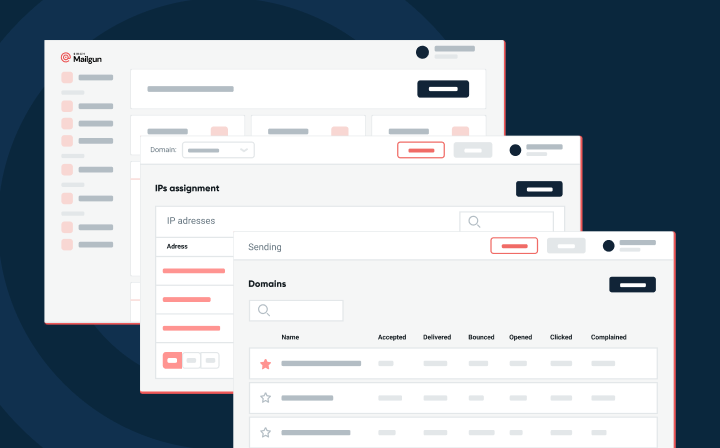
Before diving into the data, take some time to get acquainted with your statistics dashboard. This page contains valuable data to help develop insights into your sending practices. Email analytics let you drill down data, solve problems, and boost future performance.
You can choose from two standard reporting formats on a dashboard: volume and percentage. Percentage rates are great for comparing your stats to industry benchmark data or your email platform’s Acceptable Use Policy (AUP), whereas volume is the true number that puts these events into context – a 1% unsubscribe rate may not seem as alarming as 1,000 individual contacts requesting to be removed from your list.
Before you navigate through statistical filters and graphs, let’s find out about the journey an email takes and the key metrics we’re looking at.
Table of contents
01Email delivery: Journey from ESP to ISP
Email delivery: Journey from ESP to ISP
All the other metrics covered below are irrelevant if your email service provider (ESP) never delivers the message to the recipient’s email server. It’s the ESP’s responsibility to deliver emails to an ISP, handle data from the feedback loop (FBL), and take action if necessary.
Here are some common ESP metrics:
Accepted: The ESP accepted the request to send the email and the message is in the queue.
Delivered: The ESP sent the email and the recipient’s email server accepted it. Not to be confused with deliverability, which indicates the number of emails that reach the inbox. Delivery does not guarantee inbox placement.
Temporary fail: Otherwise known as a soft bounce, it means that the recipient's server is telling the ESP, "not right now, but try again later."
Permanent fail: A hard bounce or a series of repeated soft bounces means the ESP could not deliver the email and will not attempt again.
Failed (all): It shows the total number of emails that failed, combining both temporary and permanent fails stats. It means the ESP could not deliver the email to the recipient's email server.
As you can see, there are a range of "fail” metrics that often act as an indicator of different issues. In some cases, non-delivery happens because the ESP blocks the message before it gets out. In other cases, it’s the ISP that stops the email from reaching the recipient.

Let’s look at these stats in more detail.
Suppression
ESPs like Sinch Mailgun are trusted to protect your sender reputation at all costs. One way they achieve this is by automatically moving certain contacts into a suppression list if they pose a risk to your reputation. That means that sending to these addresses is blocked to prevent you from accidentally blasting these dead contacts again. Without suppression lists, your domain would run into acceptable use policy (AUP) violations and face crippling email deliverability issues.
Here are the suppression metrics for Mailgun (other ESPs may vary):
Suppressed – Hard Bounces: Email bounces that happen due to a recipient’s address being returned as invalid, non-existent, or temporarily misconfigured.
Suppressed – Unsubscribed: Recipients that have clicked on an unsubscribe link, stating that they don’t want to continue receiving your emails.
Suppressed – Complaints: Recipients that have previously clicked on the “mark as spam” button in their inbox to complain about your sending.
A common misconception is that removing suppressed contacts from your database will keep your lists clean. This is not true. If an email address hard bounces, you don’t need to delete the contact from your CRM or database. The fact is, the person behind that mailbox might still be a customer that wants to hear from you, but simply switched mailboxes. What is true, however, is that you must stop sending emails to hard-bounced mailboxes to protect your deliverability – just don’t delete the data you have about them and, if you can, try to reach out via alternative methods.
Bounces
Emails that are unsuccessfully delivered to your recipient's mailbox are recorded as a bounce. Bounces are a dialogue between the sender and the mailbox provider to help identify and solve delivery issues. For example, Gmail will bounce back a message with the time and date that your email bounced, the server name, and the reason for the bounce with an associated RFC (request for comments) code.
If you consistently ignore your high email bounce rate, a mailbox provider may assume you are:
Purchasing third-party email lists
Failing to recognize opt-outs and unsubscribes
Not adhering to other email best practices
Attacking or attempting to abuse their servers
A high bounce rate will eventually result in a diminished sender reputation. Perhaps you’re thinking, “That’s not fair – I just haven’t found the time to sort this out yet.” Unfortunately, ISPs and mailbox providers must be strict to deal with a never-ending stream of bad actors. It’s for this reason that bounce management is a key component of achieving good deliverability rates.
But not all bounces are created equally. Let’s distinguish the difference between soft and hard bounces.
Soft bounces
Soft bounces, otherwise known as temporary failures, are emails that are not initially delivered, but there will be an automatic delivery re-attempt by the ISP. Eventually, if an ESP keeps receiving soft bounce error codes, they will stop retrying and the email will be classed as a permanent fail.
So why are these emails not getting delivered? This can happen for various reasons:
The recipient's mailbox is full.
The email in question is too large.
The mail server was down at the time of sending.
The email address in question is suspended.
Quite often, the reason for a soft bounce does not come down to the sender. Bounce management software can detect this and automatically attempt redelivery at a later date. A soft bounce is good in the sense that the email address in question is indeed valid and does not need to be added to a suppression list.
Hard bounces
On the other hand, hard bounces or permanent failures will never make it to the recipient's mailbox. In some cases, that’s simply because of a typo or that no record of that email address exists anymore. Mailbox providers and ISPs take a hard stance on senders who continually take up bandwidth with invalid requests such as these. So, to keep your contacts list and reputation clean, an ESP like Mailgun will automatically add these contacts to a suppression list, preventing further hard bounces from occurring.
Email deliverability: Landing in the inbox
Okay, so your message didn’t bounce and you’ve arrived in the inbox. Congrats! That means that you’re following deliverability best practices and the ISPs are letting your emails get directly to your recipients. But the story doesn’t end there – the next step in our email metrics journey is how recipients react to your email after it has arrived, which in turn, will have a direct impact on your future email deliverability.
Let’s run through all the possible actions your subscriber list can take.
Opened
Opens are the number of delivered emails that senders have clicked on from their inbox view. Mailgun’s analytics dashboard allows you to see both total opens and unique opens. Total opens indicate all the open events for a specific email campaign – that is, the number of times that email was opened. On the other hand, unique opens show how many unique recipient addresses have opened your emails.
It’s a positive sign of how engaged your recipients are and the quality of your subject line, BIMI branding, and preheader text. Open rates are closely correlated with your inbox placement, the health of your list, and how effective your audience segmentation is.
Many senders obsess with improving their email open rates, but we recommend that you look at them as a signpost instead of a hard fact. This metric is tracked by a single-pixel image in the message. So if the user has a preview pane, an Apple email client (13% of users), or has images blocked, then the open will not register and the number of total and unique opens will not be reliable. So, take this metric with a pinch of salt.
Clicked
Arguably the most sought-after email metric, click rates, require users to open the email and click at least one link or CTA. There is, however, a fork in this metric: click-through rates and click-to-open rates. The distinction is worth remembering as they are very different stats.
Click-through rate (CTR) is the number of clicks divided by total emails sent.
Click-to-open rate (CTOR) is the number of clicks divided by the total opens.
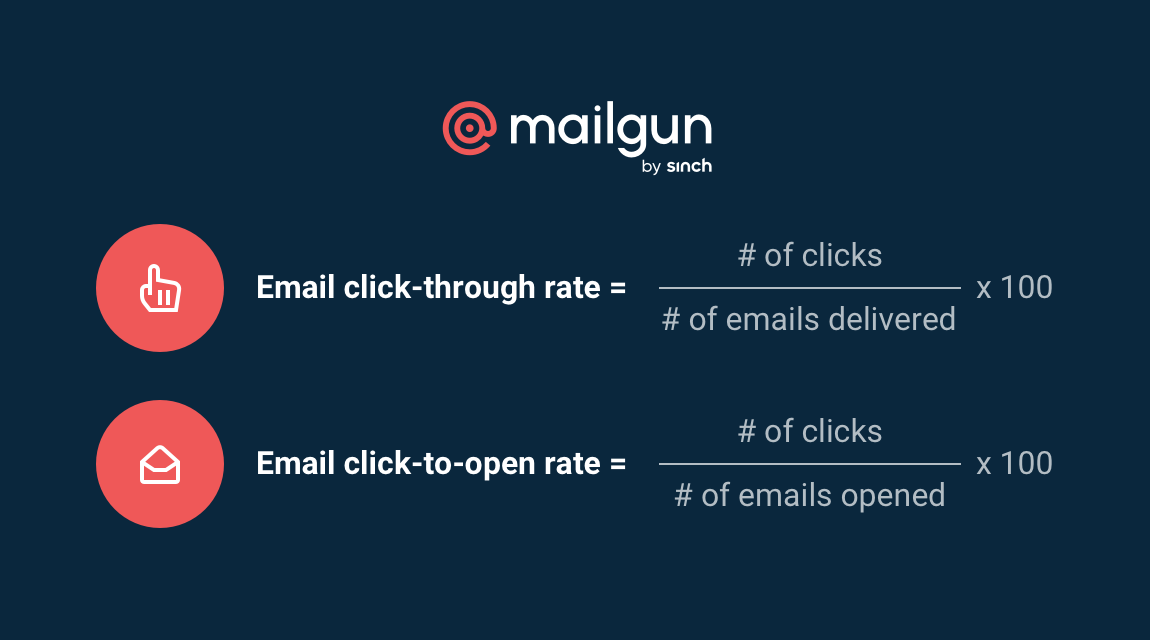
This is how click-through and click-to-open rates are calculated.
But there is a limitation with this metric. Firstly, a click stat will not show you multiple clicks within an email. To get this information, you will need to establish an attribution system using UTMs for link tracking. Sinch Email on Acid can generate heat or click maps to illustrate how users interact with your email campaigns.
Low click rates might indicate that you’re not effectively targeting and driving them to take action, leading to a low conversion rate and poor return on investment. There are methods to improve click rates and email engagement overall, involving content, design, list segmentation, and A/B testing.
Unsubscribed
An unsubscribe occurs when a user asks to be removed from your database. This is calculated as a percentage of the total mailing list. There are three types of unsubscribes:
Domain: It unsubscribes the recipient from all messages in your domain.
Tag: It unsubscribes the recipient from all tags provided in the message.
Mailing lists: It unsubscribes the recipient from future messages sent to a mailing list.
Unsubscribes aren't all bleak – they serve an important purpose for senders. Instead of having to manually clean your lists, you can view recipients as automatic list cleaners. And remember, users may have clicked unsubscribe, but then opted to stay subscribed to other relevant mailing lists.
Be aware, since Apple’s iOS10, most mail clients have made unsubscribing easier than ever by adding their own unsubscribe button in a prominent position instead of the bottom of emails. Therefore, users are more likely than ever to unsubscribe if they feel your content is irrelevant, spammy, or uninteresting.

Users can now find the unsubscribe button in a prominent position on Gmail.
Complained
Here’s where inbox providers’ ears perk up. Spam complaints occur when a user hits the “mark as spam” button within an email. You can expect higher complaint rates for email marketing campaigns and lower rates for transactional messages. It’s an ISP’s most efficient way to weed out email spammers but also the most dangerous statistic on this list.
It’s for this reason that ESPs like Mailgun use Feedback loop (FBL) notifications to track this data and automatically add the recipient to a suppression list. This protects your sender reputation and prevents future emails from going straight into the dreaded spam folder.
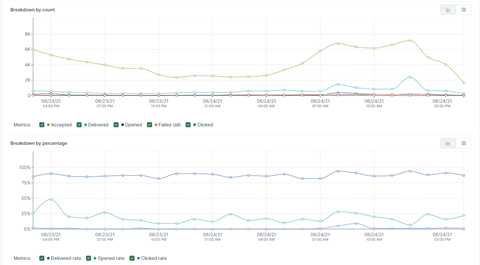
Choose an ESP with advanced reporting
There you have it. Email metrics offer a wealth of information to gauge the performance of your email program. From email delivery to opens and clicks, having access to comprehensive data is key to pinpointing issues and start troubleshooting potential threats to your deliverability.
But in order to track the journeys of your email campaigns and the health of your lists, you need access to real-time data insights that can be easily segmented and digested. Whether it’s pulling a report with the main email KPIs for a team meeting or getting targeted questions answered, your ESP’s analytics dashboard should enable you to slice and dice your data the way you need and to drill down into specific areas of your email performance.
Mailgun’s cloud-based dashboard lets you see key email performance indicators that help form your email strategy. So if you need to know which A/B tests to perform, how to segment your audience, or what time of day to send, Mailgun’s reporting dashboard has got you covered.

